EDS - Energy dispersive X-ray spectroscopy
Energy dispersive X-ray spectroscopy (EDS) can be used to determine the elemental composition and distribution of a substrate. The EDS detector is connected to a scanning electron microscope whose focused electron beam is either scanned over the surface of the sample for analysis or deflected to a selected point on the sample. The primary electron beam, typically accelerated with 5-30 kV, penetrates the substrate to a depth of a few µm and creates hole states. If these are filled up by electrons of higher energy shells, the element-specific energy difference can be emitted either in the form of an Auger electron or X-rays. X-rays contribute to the signal almost undisturbed from a depth of just a few µm. Therefore, the spatial resolution for EDX is essentially determined by the energy of the primary beam and not by the focus of the electron beam. In combination with the already existing SEM function, element map scans can be made which combine the very good lateral resolution of the SEM with the signal of the EDX detector.
JEOL SSM-6500F
Our electron microscope is equipped with an Oxford INCA Energy 200 EDS system with a crystal type 300 (energy resolution 133eV). The lateral and depth resolution is strongly dependent on the elements present and the energy of the primary beam and can typically be estimated at 0.2 - 2 µm. Point, line and area spectra as well as element map scans can be recorded.

FTIR - Infraredspectrometer
Infrared spectroscopy is primarily a method of analyzing known substances or identifying unknown substances. The sample is examined with light in the wavelength range from 2.5 µm to approx. 25 µm (wavelengths 4000 cm-1 - 400 cm-1). This area is particularly suitable for stimulating oscillation and rotational states in molecules. The absorbed frequencies of the analyzed spectrum can then be used to make statements about the chemical bonds and the elements involved.
FTIR spectroscopy refers to a special area of IR spectroscopy. Nowadays, a Michelson interferometer with a periodically oscillating mirror is mostly used for this purpose. The interferometer converts the incident light into two partial beams that interfere with each other at the detector. Over a full movement of the mirror, an interferogram characteristic of the wavelengths involved is generated at the detector. If a sample is in the beam path, characteristic frequencies are absorbed and no longer contribute to the interferogram, or less so. The analysis is performed simultaneously over all wavelengths of the spectral range. On a PC, the spectra can be extracted from the interferograms by means of Fourier transformations. The actual spectrum of the substance is obtained by subtracting the reference spectrum from the spectrum with sample.
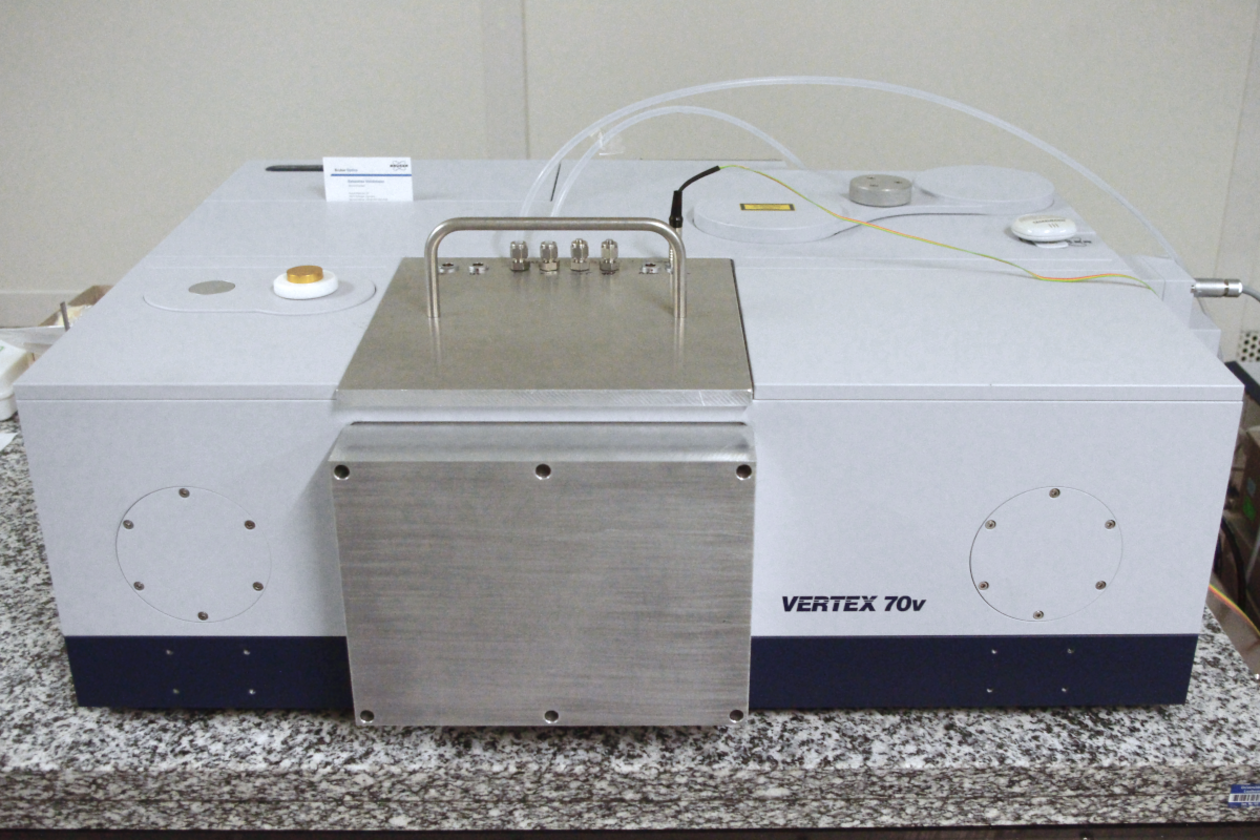
Bruker Vertex 70/80v
Different specimen holders - transmission (e. g. KBr pellets), DRIFTS (Harrick Praying Mantis) and ATR (Harrick Horizon) - are available.
Raman Spectrometer
Similar to IR spectroscopy, Raman spectroscopy produces a fingerprint that is characteristic of the sample under investigation. This fingerprint is based, among other things, on the oscillation and rotational states of the molecules and enables statements to be made, e. g. about crystallinity and crystal orientation, composition, temperature, and tension.
Raman spectroscopy is based on the inelastic scattering of monochromatic light, typically of a laser, on molecules, whereby the energy of the incident photon changes by the amount of the transition to another state of vibration. Since at room temperature most of the molecules are in their basic state , the interaction process in which the molecule is left in a higher state dominates and the emitted photon has a correspondingly lower energy and therefore a higher wavelength. These lines in the Raman spectrum are called Stokes lines. If the interaction with the incident photon excites the molecule to a lower energy state, the scattered photon has a higher energy and thus a shorter wavelength. The corresponding lines in the spectrum are called anti-Stokes lines.
One of the major advantages of Raman spectroscopy is that the volume of information can be limited to less than 1 µm3, determined by the microscope's optics and the wavelength of the laser used. Furthermore, samples can also be analyzed in an aqueous medium because water molecules do not contribute to the Raman signal due to their permanent dipole moment.
Horiba -JY HR800
The HR800 is based on an Olympus BX41 microscope with motorized X-Y stage. The lateral resolution is < 1 µm.